Advanced Biostatistics
Chapter 7: Nonlinear Regression with AR1 Errors

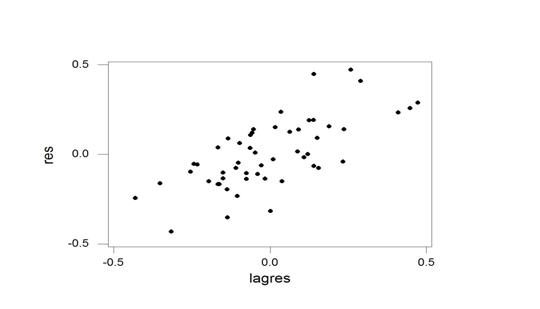
The above mean curve
suggests LL3 model function, ![]() , and plot of Residuals versus Lagged-Residuals suggests
AR(1) time series error structure, et = fet-1 + at, -1 < f < 1, where the at are assumed to be independent
N(0,s2).
, and plot of Residuals versus Lagged-Residuals suggests
AR(1) time series error structure, et = fet-1 + at, -1 < f < 1, where the at are assumed to be independent
N(0,s2).
Independent LL3 Model
|
start neg2lla(th) global(xx,yy,nn); th1=th[1]; th2=th[2]; th3=th[3]; sig=th[4]; sig2=sig*sig; tt=xx/th3; den=1+tt; eta=th1+(th2-th1)/den; res=yy-eta; thingy=nn*log(sig2)+(1/sig2)*t(res)*res; return(thingy); finish neg2lla; |
|
MINN2LLA
= -124.5789 THA
SESA 54.299768 1.384656 5.6606322 0.4736729 7.9605237 0.5770078 0.1913774 0.0130267 |
AR(1) LL3 Model
|
start neg2llb(th) global(xx,yy,nn); th1=th[1]; th2=th[2]; th3=th[3]; sig=th[4]; rho=th[5]; sig2=sig*sig; omr2=1-rho**(0.20); sig2a=sig2*omr2;
tt=xx/th3; den=1+tt; eta=th1+(th2-th1)/den;
res=yy-eta; rest=res[2:nn,]; ress=res[1:(nn-1),]; resp=rest-(rho**(0.10))*ress;
thingy=nn*log(sig2a)-log(omr2)+(1/sig2a)*( omr2*res[1]*res[1]+t(resp)*resp ); return(thingy); finish neg2llb; |
|
MINN2LLB
= -159.3582 THB
SESB 54.214864 2.72031 5.8524633 0.8959594 8.0248275 1.13469 0.1930062 0.0222893 0.0282681 0.0279577 |